Volume profile is one of the most popular and used methods to analyze the markets and to find the best levels to trade from and to use as targets.
Many traders prefer to use these levels as key support and resistance levels (also known as Balance zones) and others prefer to trade the Imbalance way (when price leaves the balance zone, our assumption is that the price will return to re-create the balance zone).
With any trading style, volume profile is a very important technical tool for traders because the volume represents where the real buyers and sellers are located. But we’ve decided to make it even better and more useful for traders!
We’ve created our indicator that provides you both volumes scan on ANY timescale you choose AND shows you at the same time, the KEY resistance and support zones!
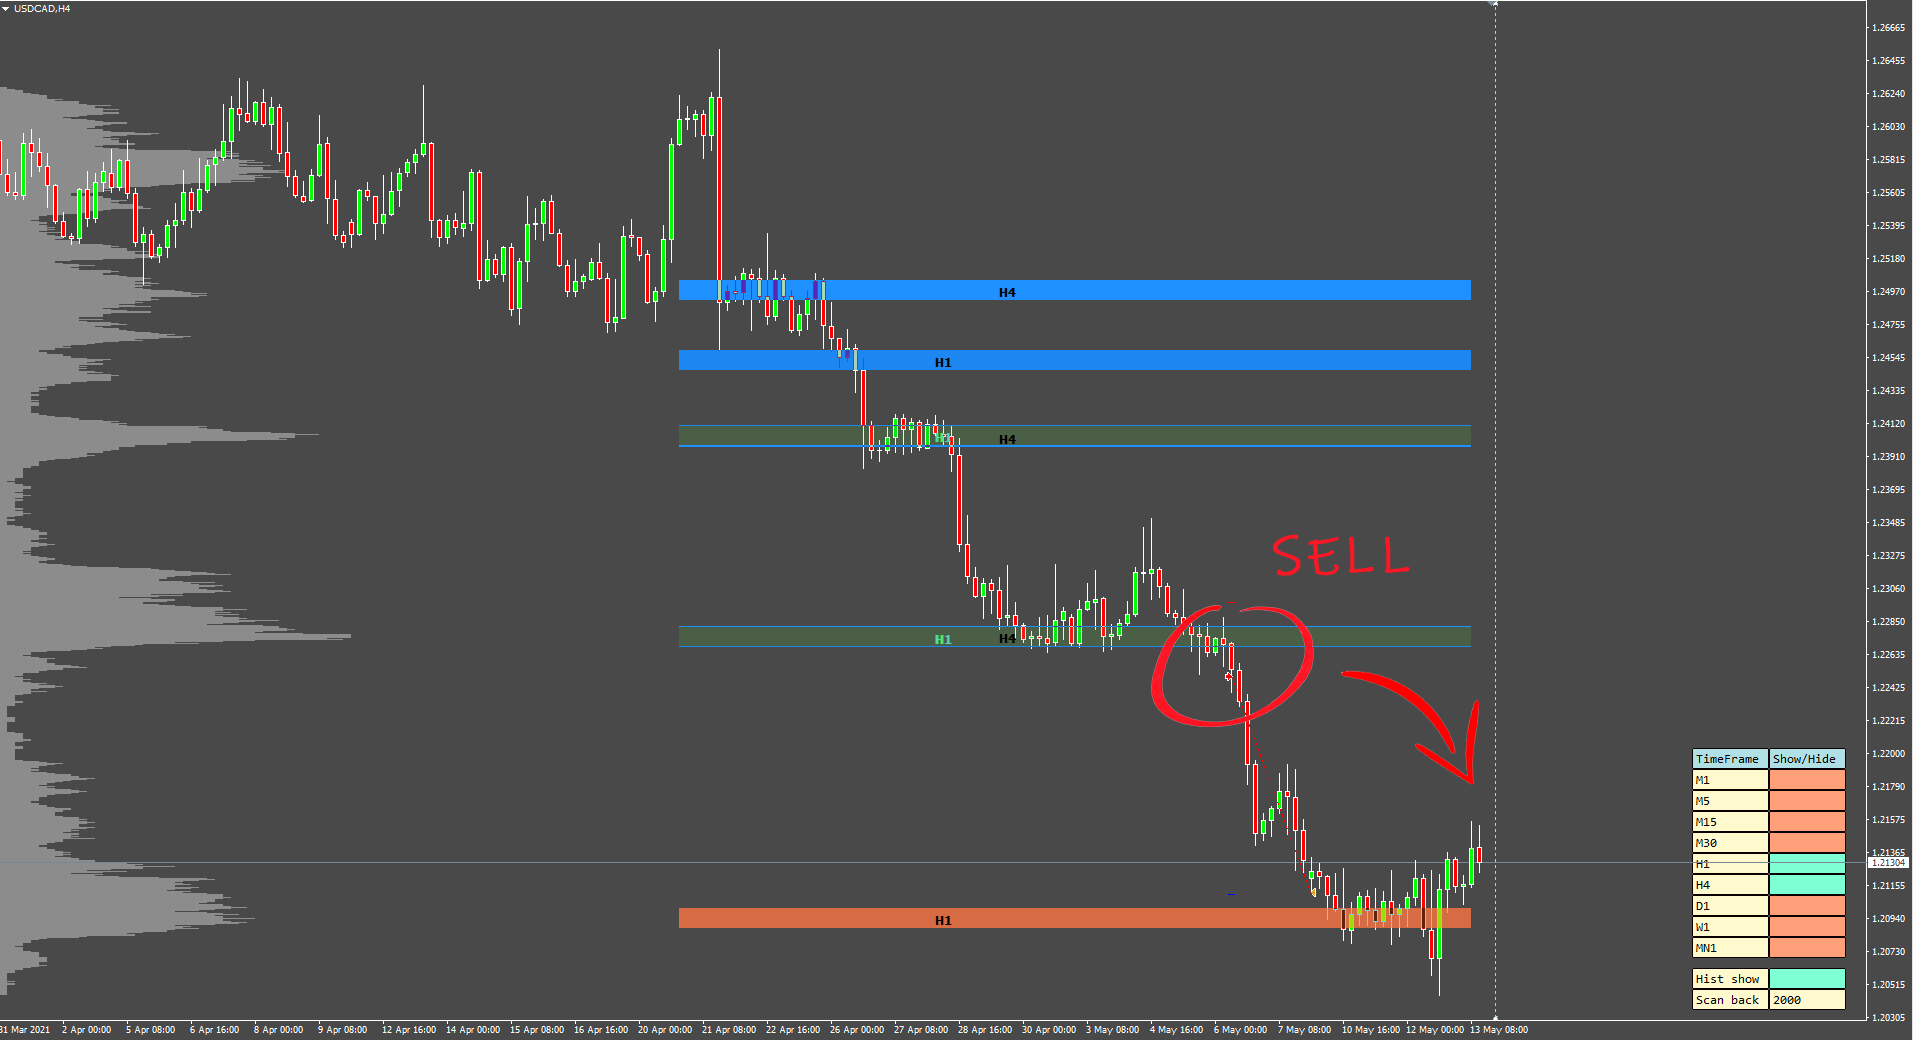
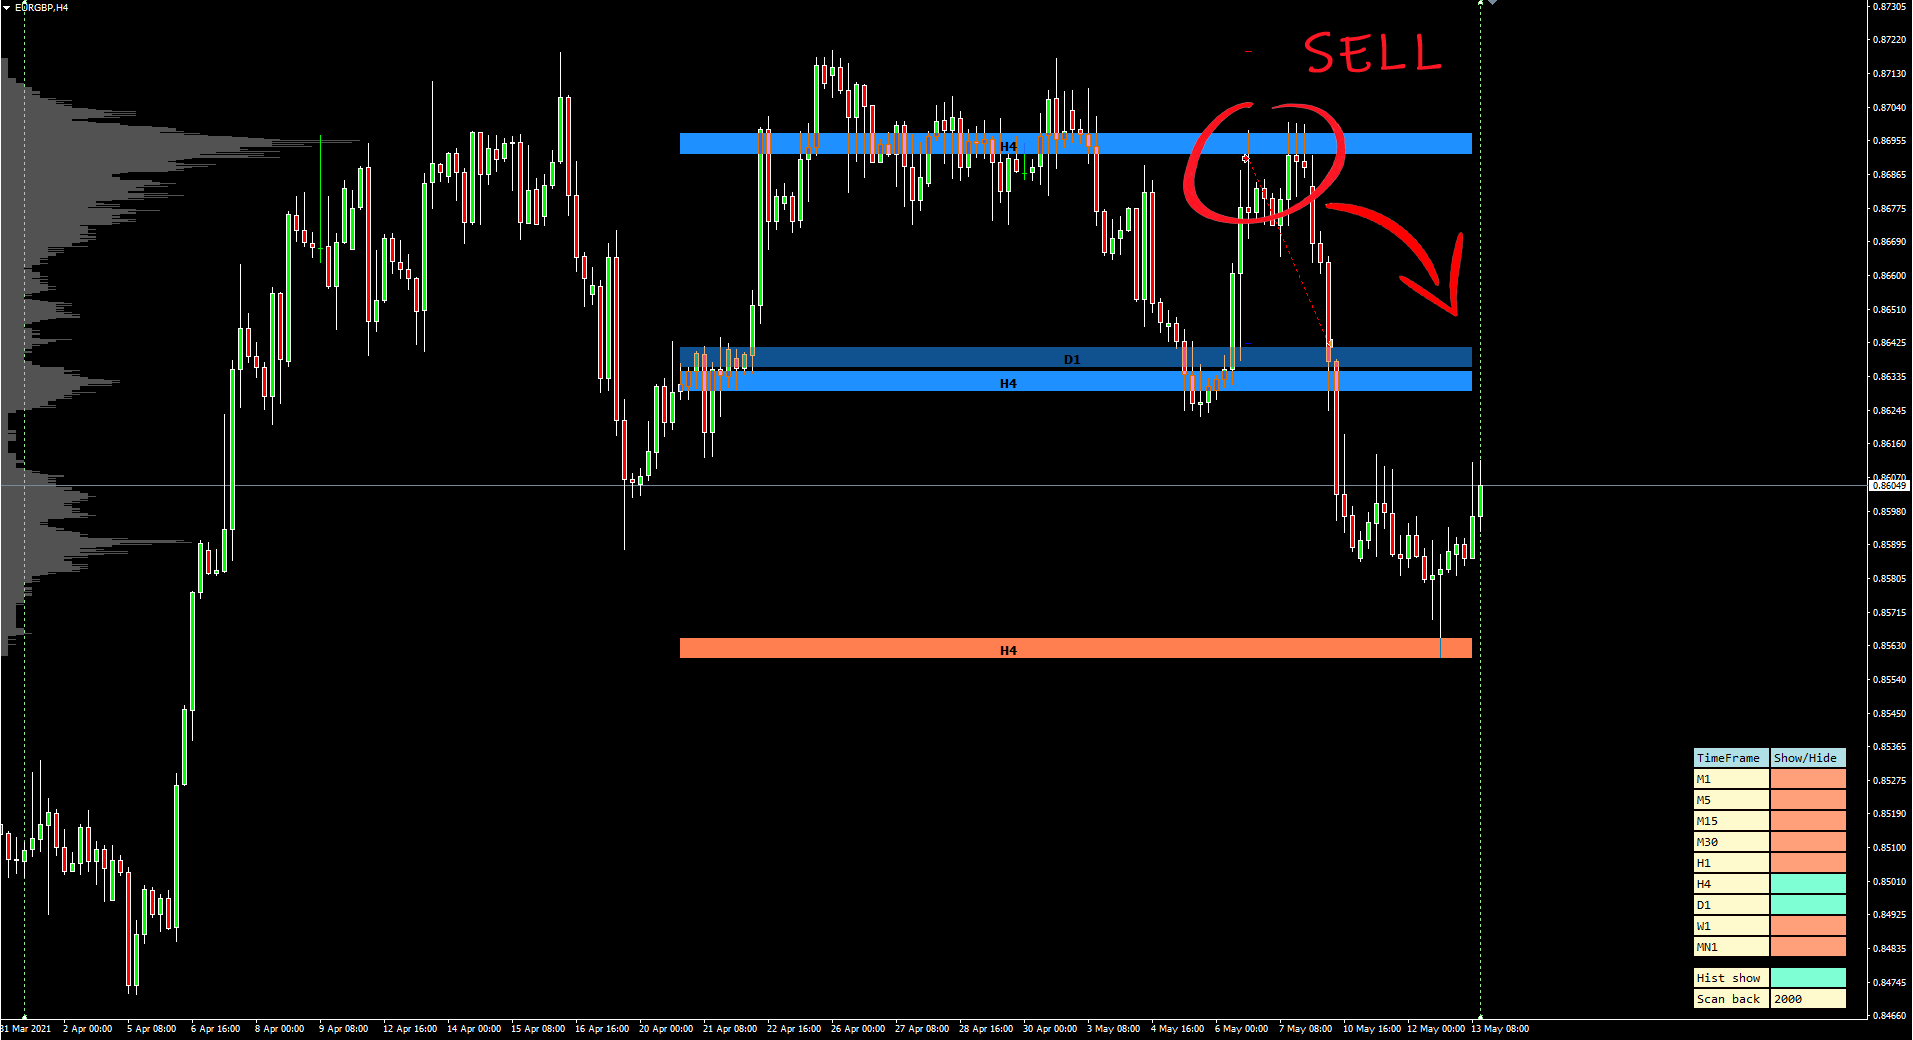
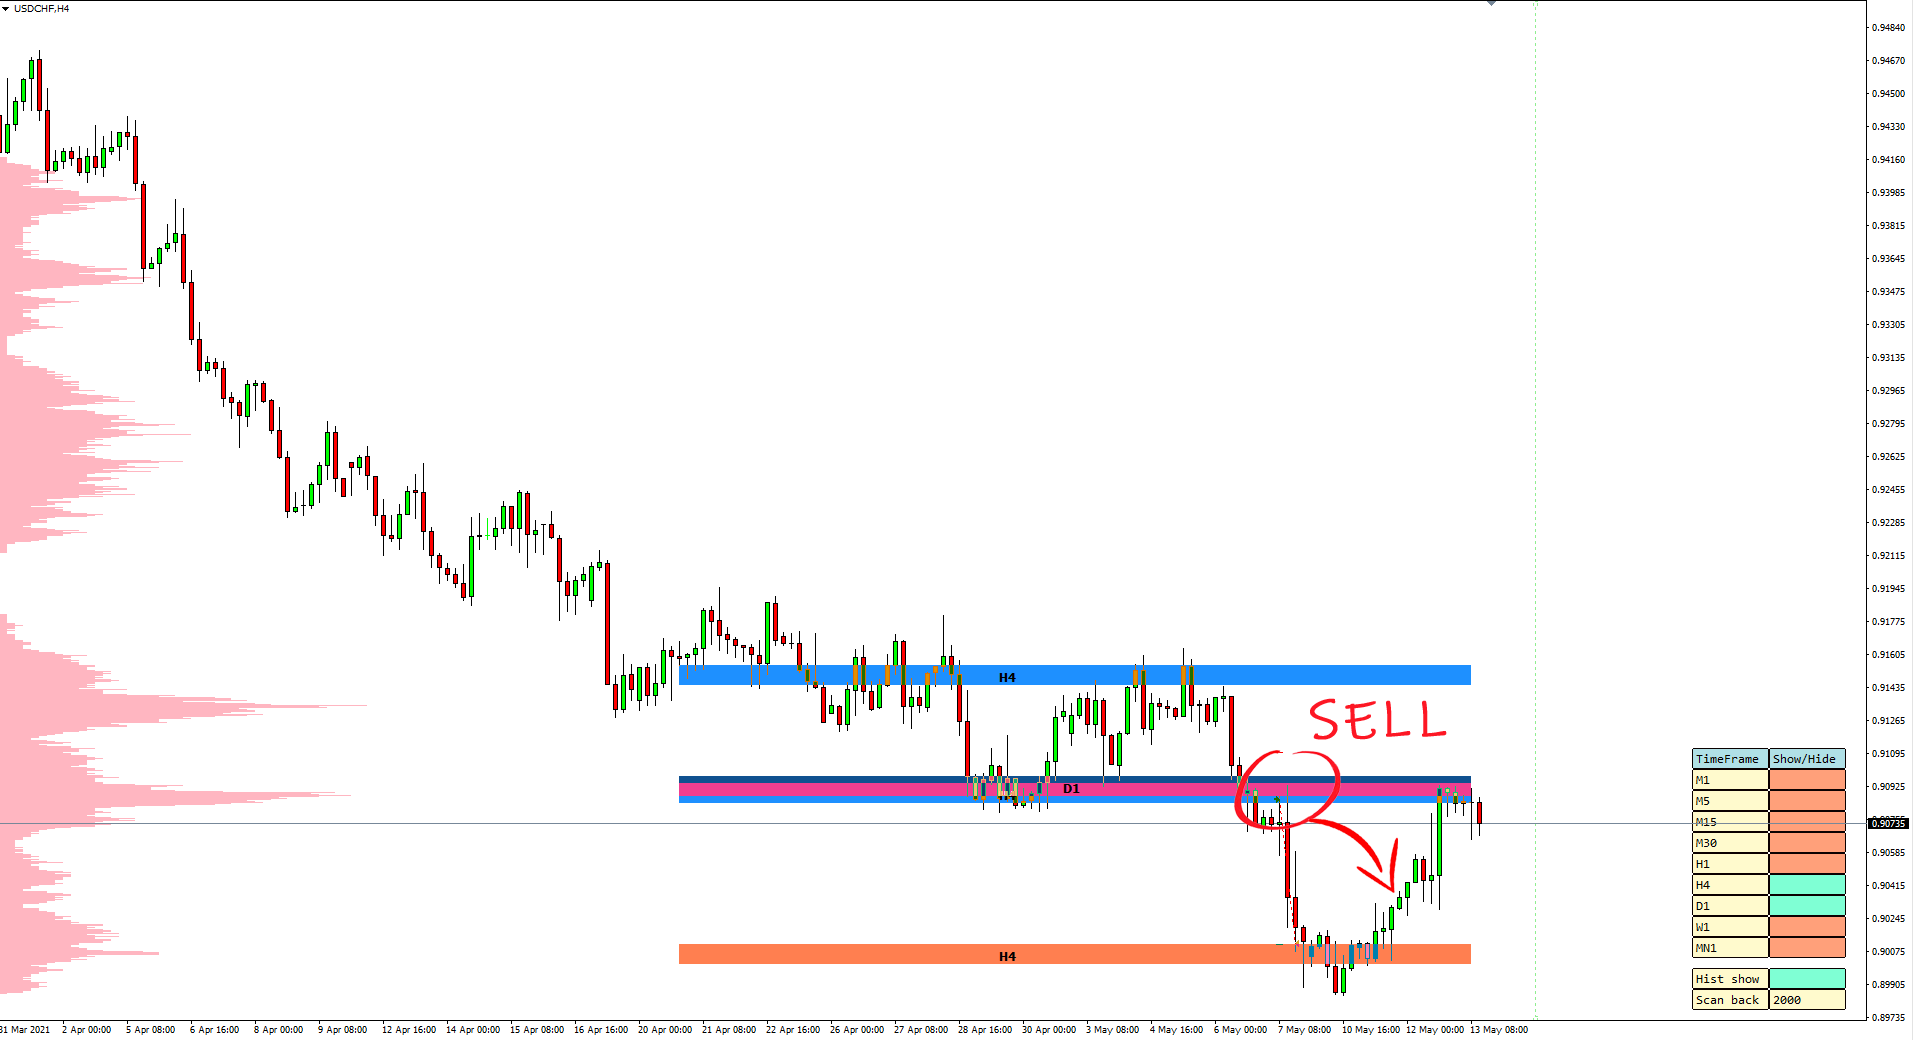
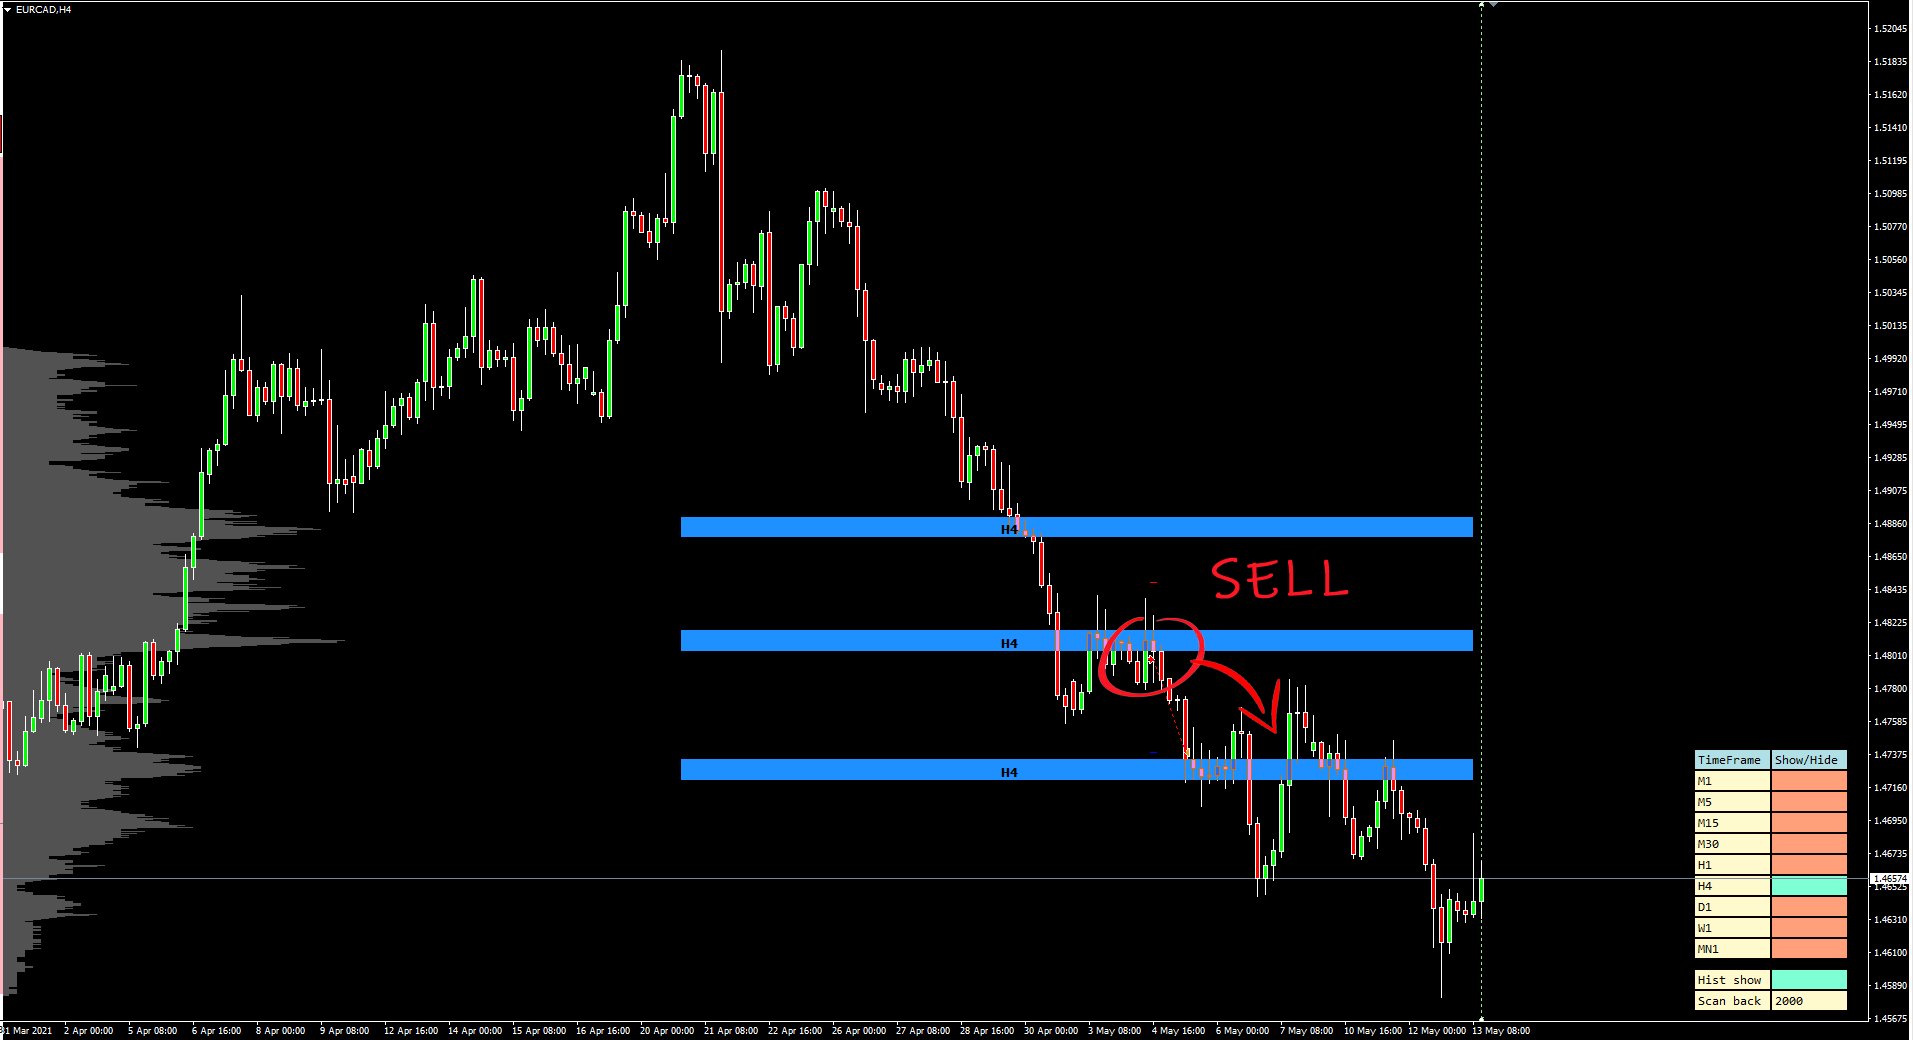
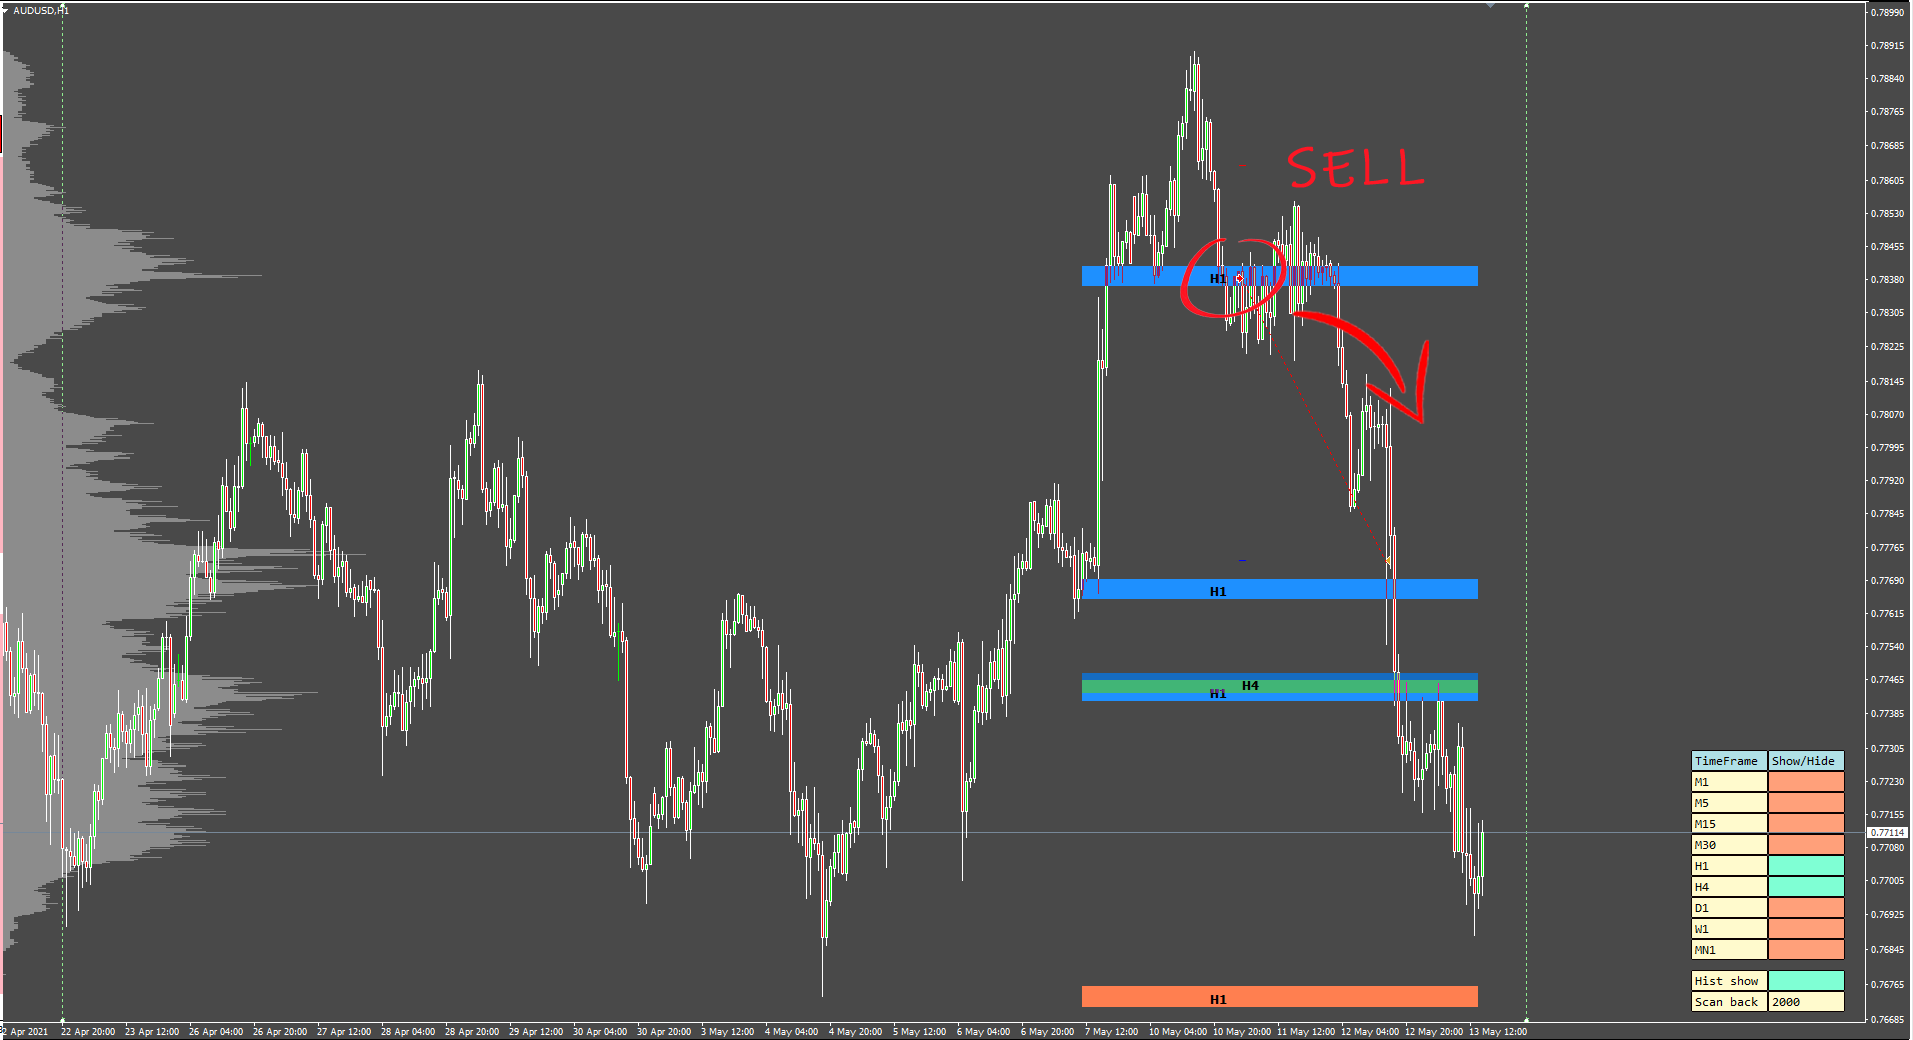
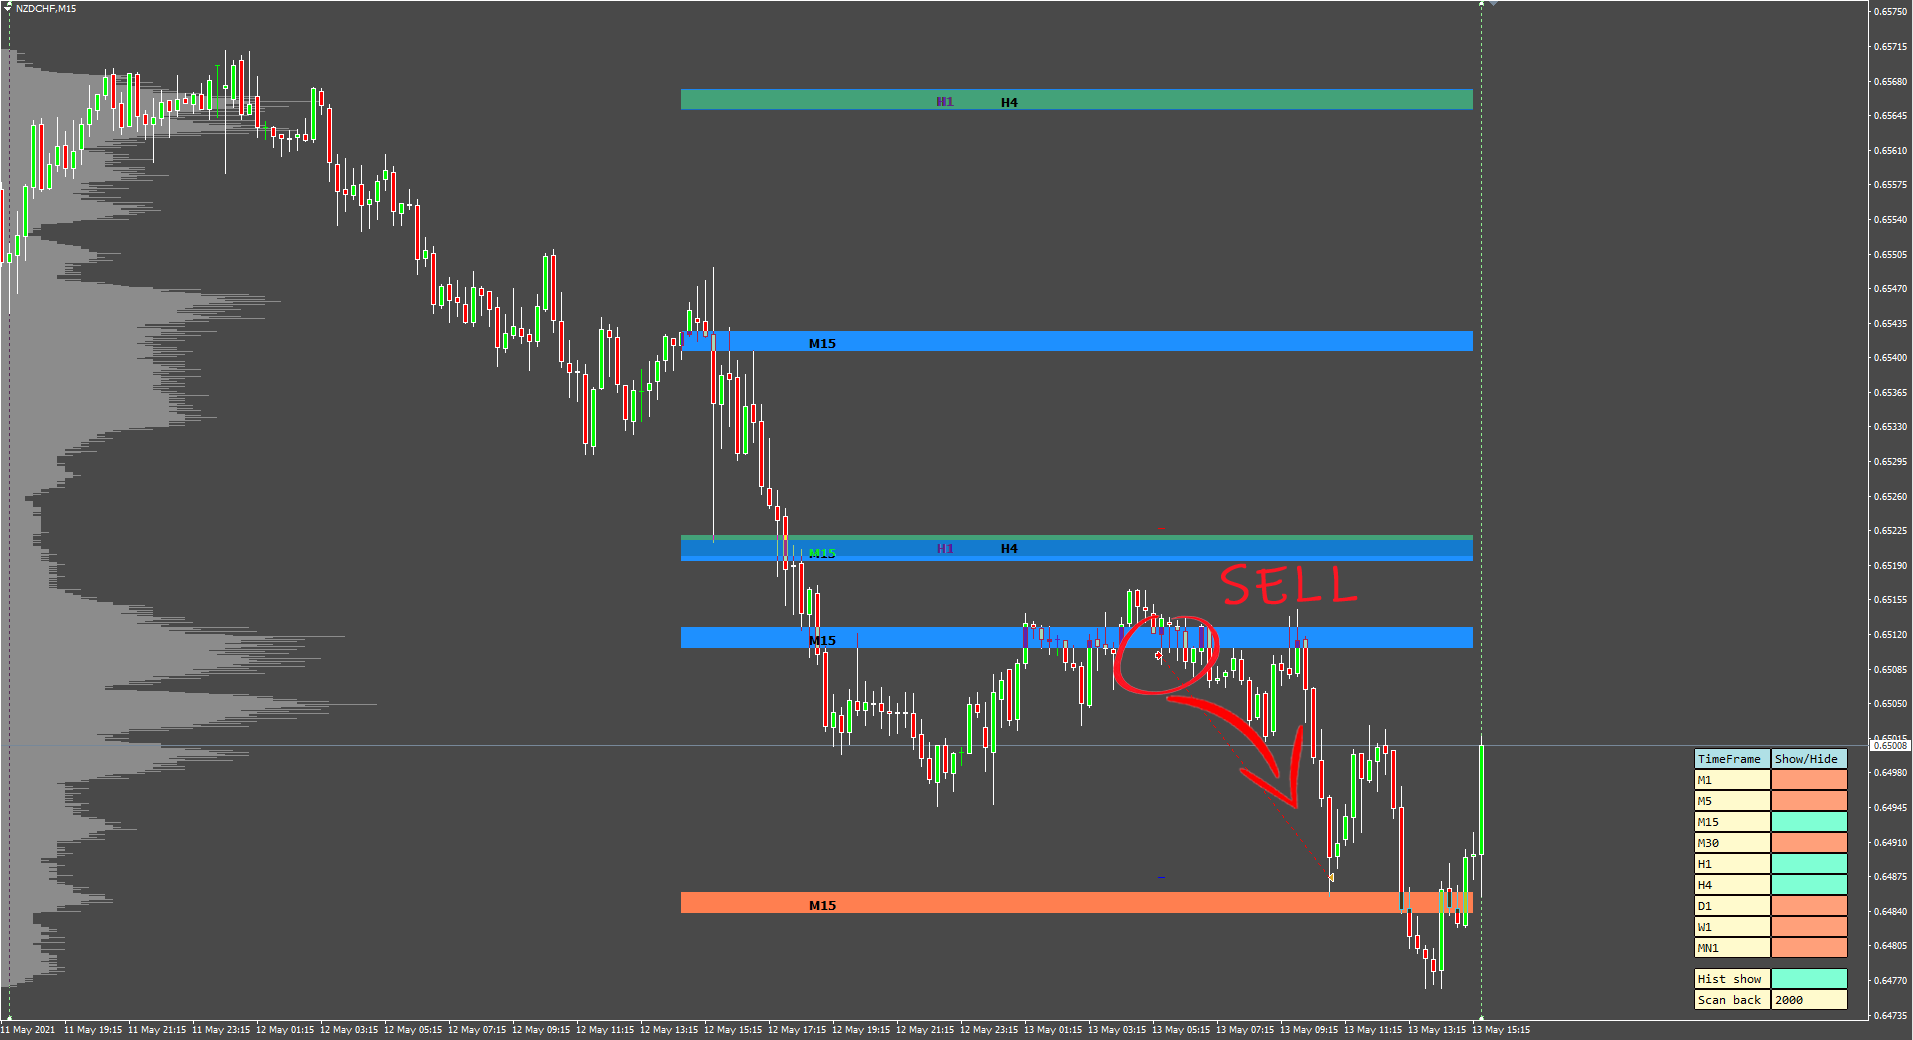
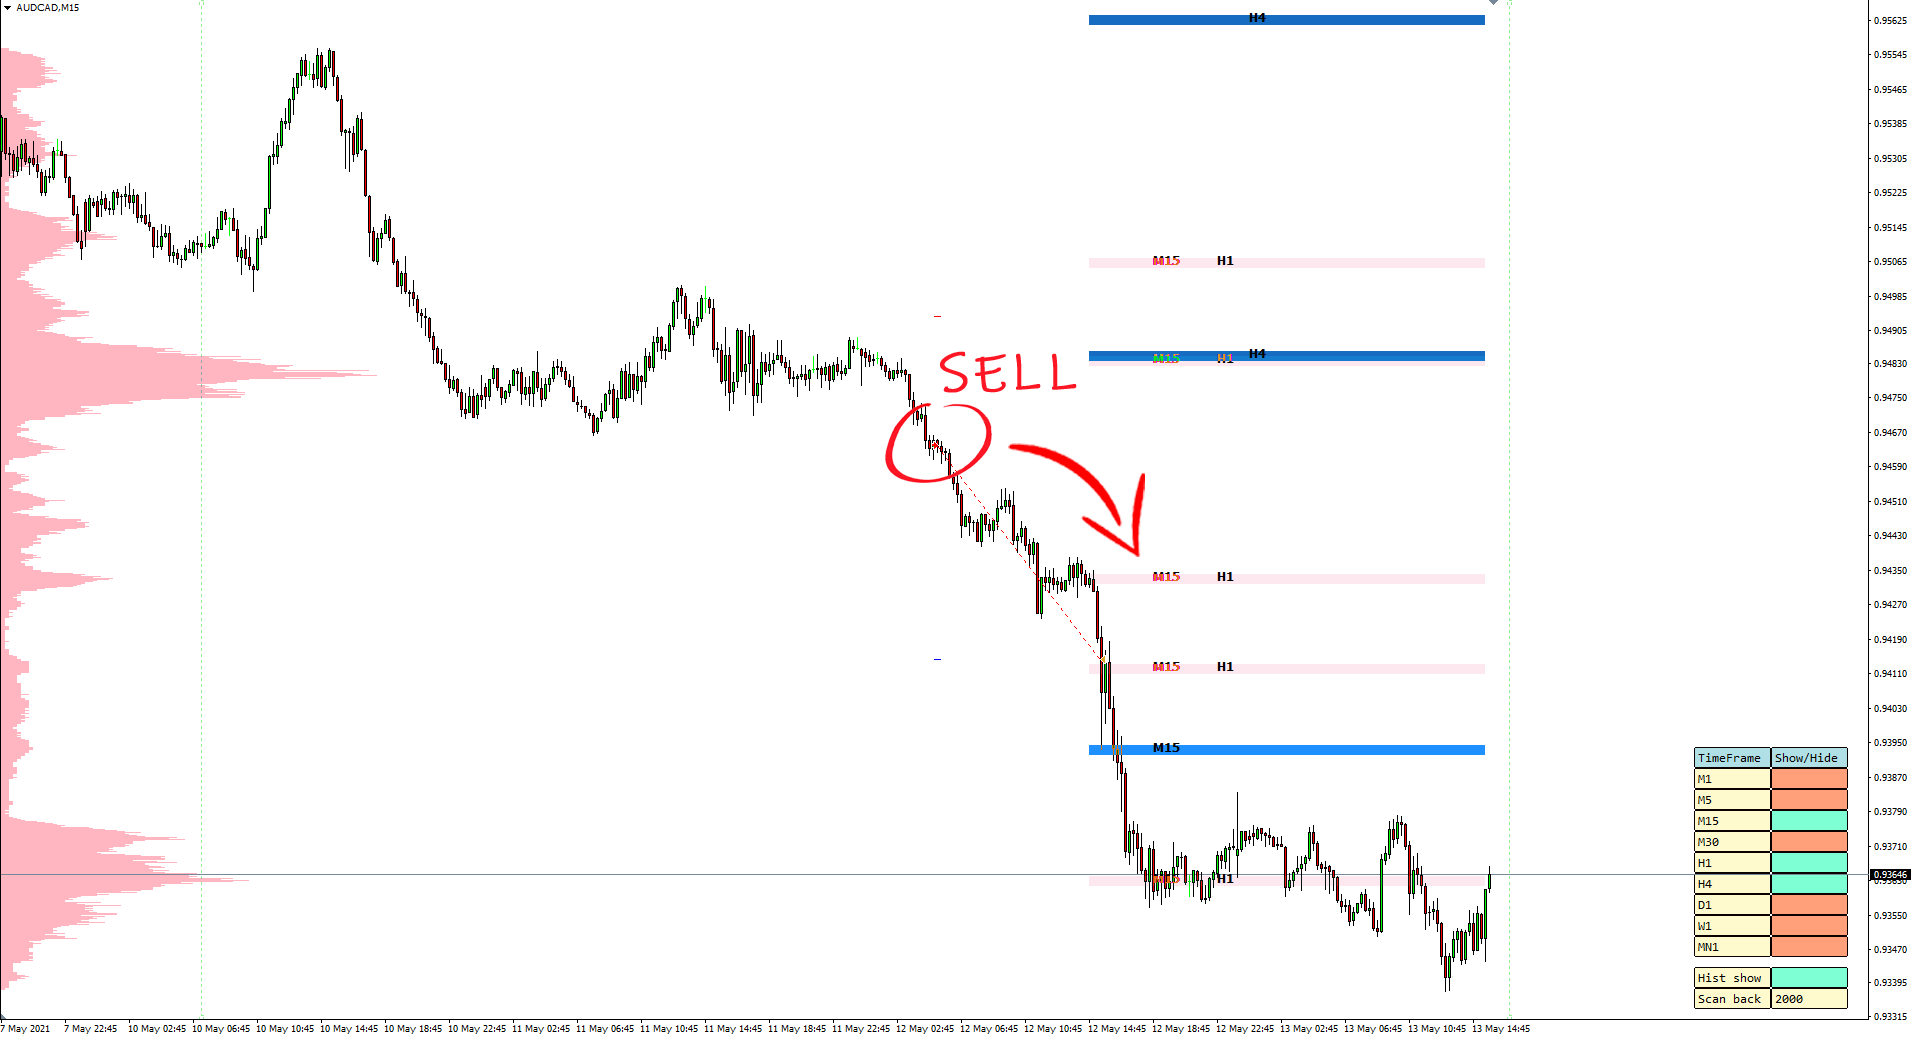
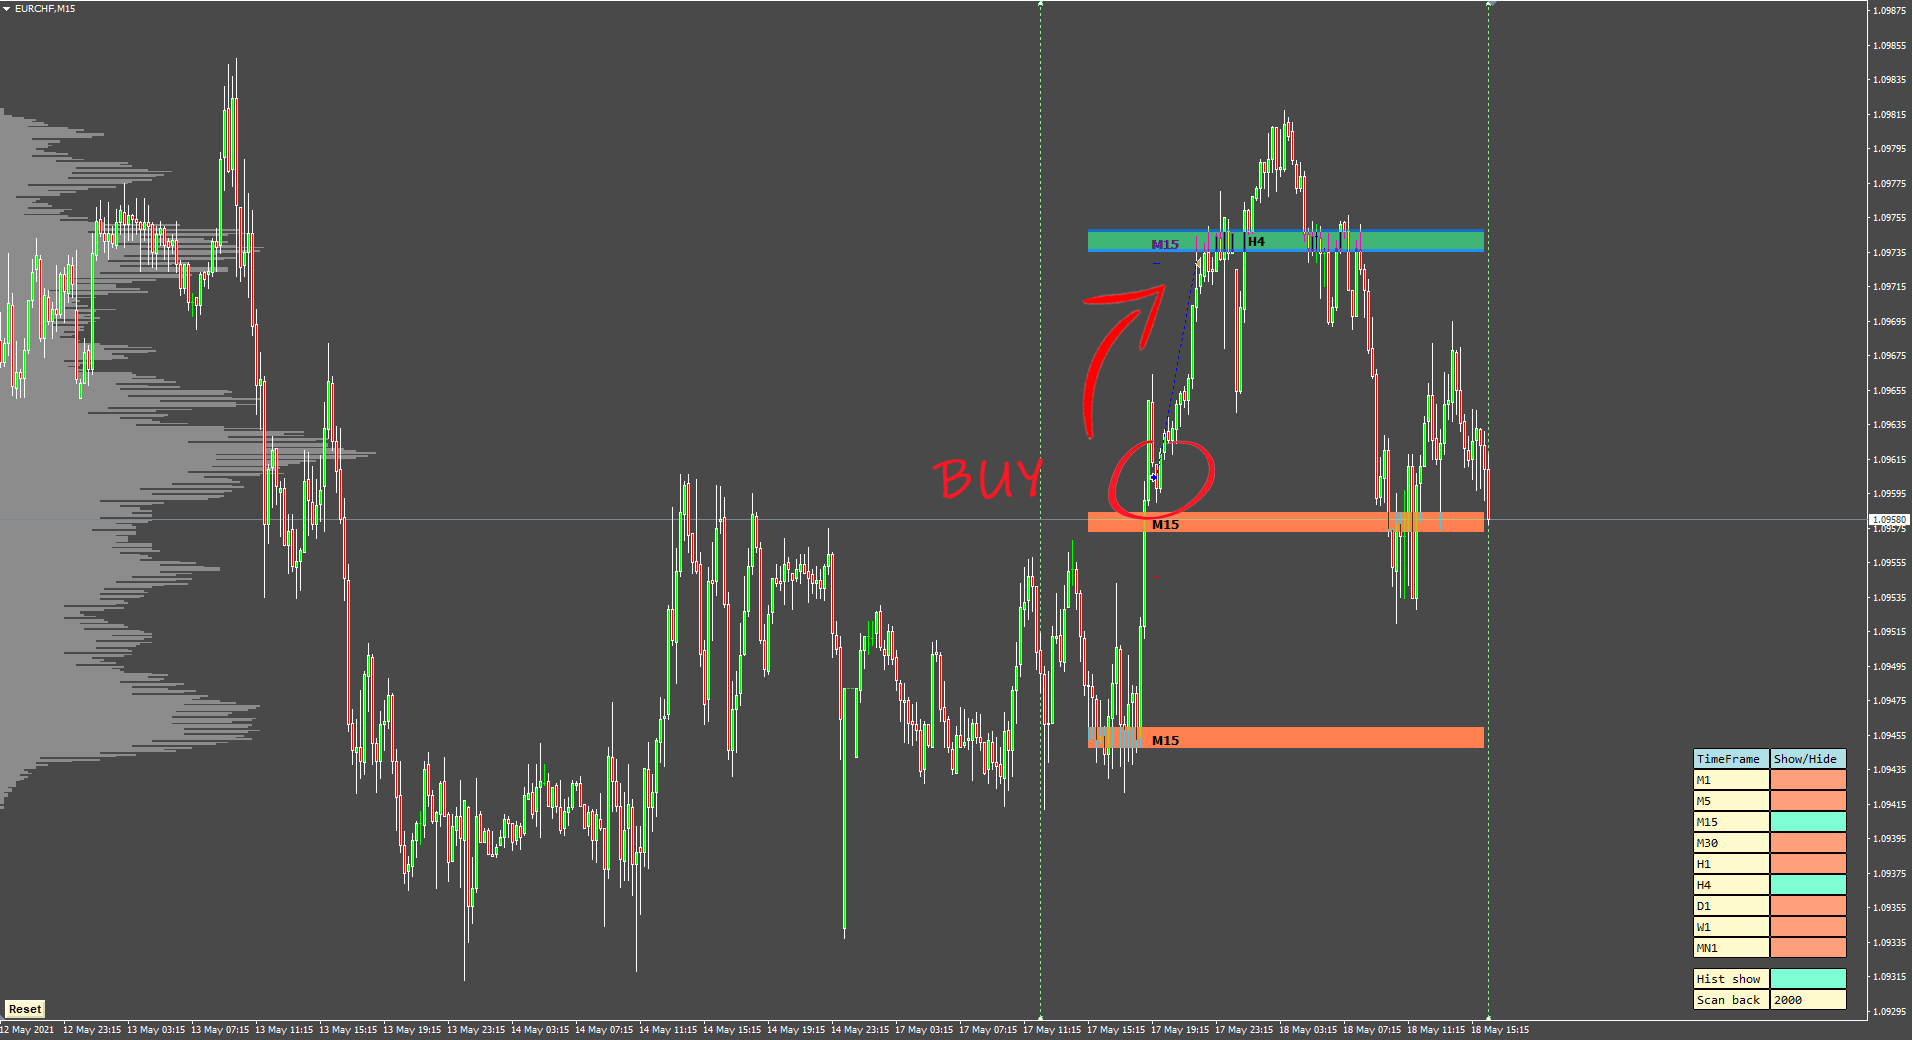
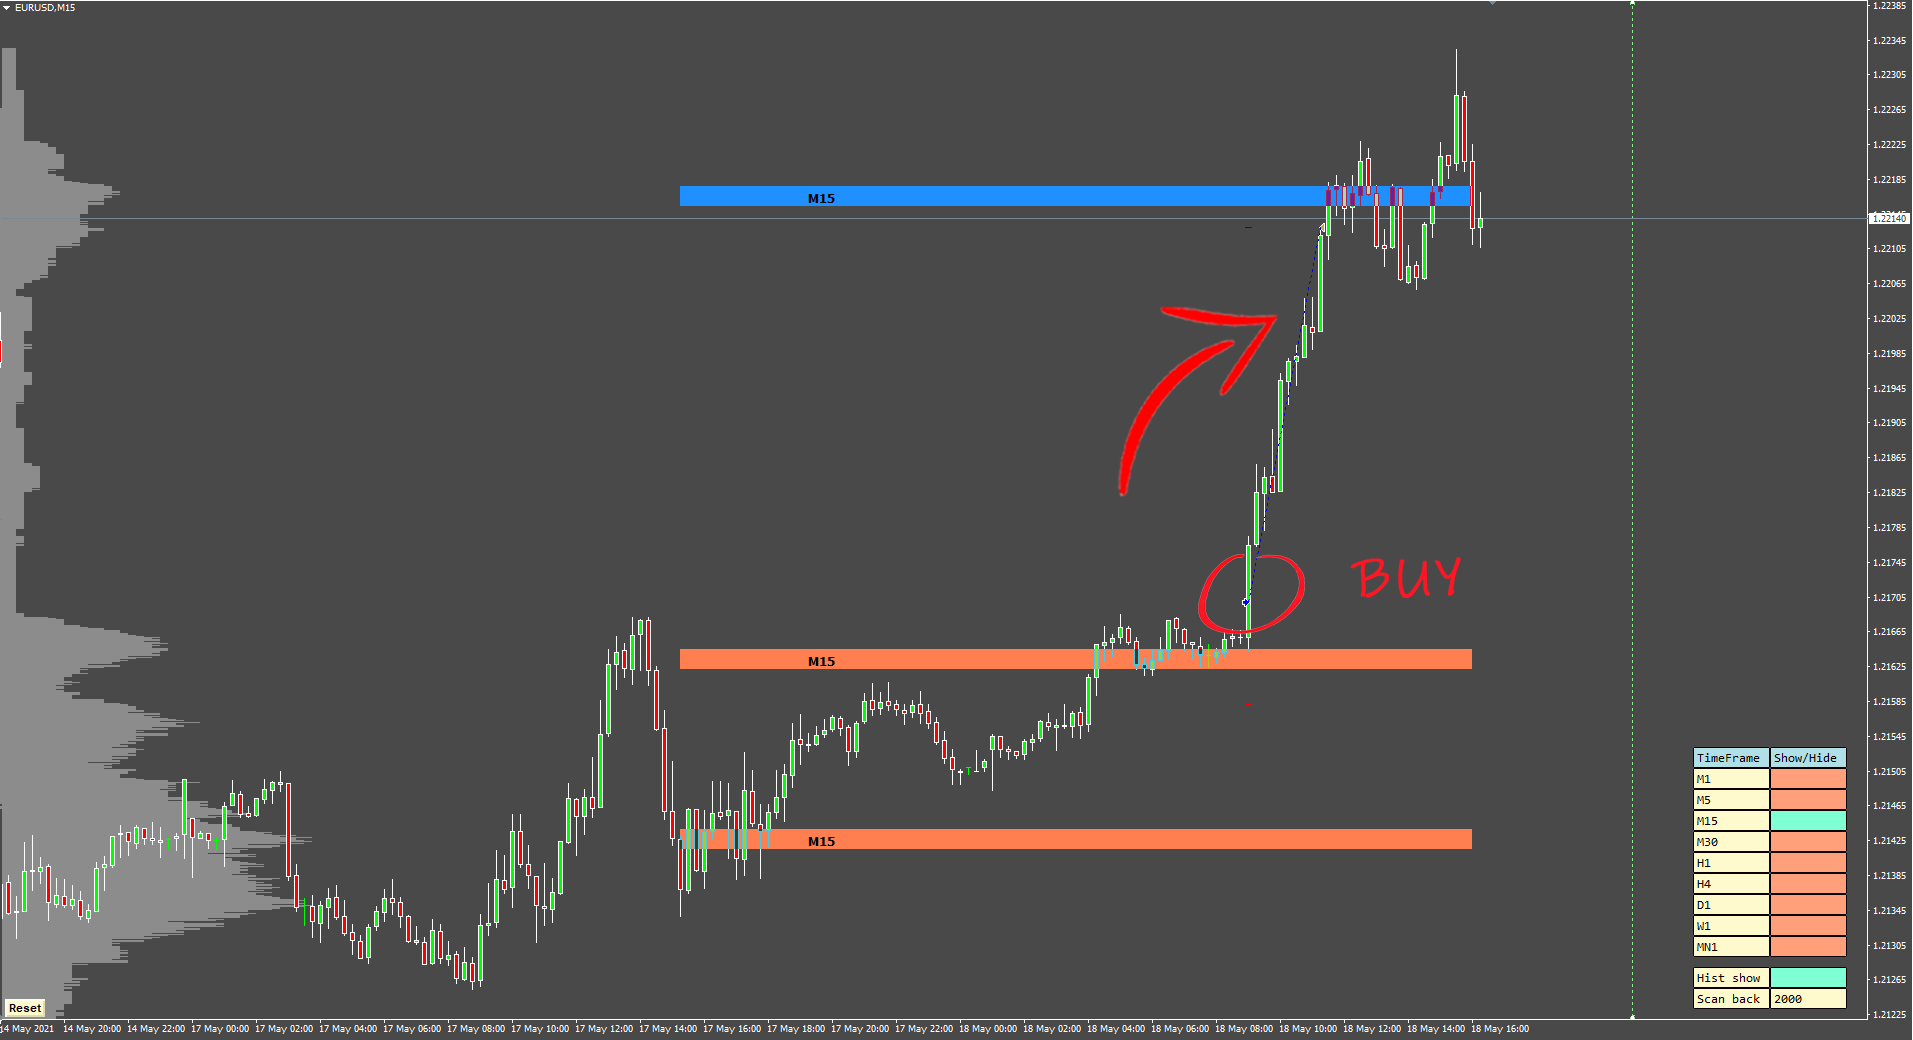
Here is how the KTLI looks in action
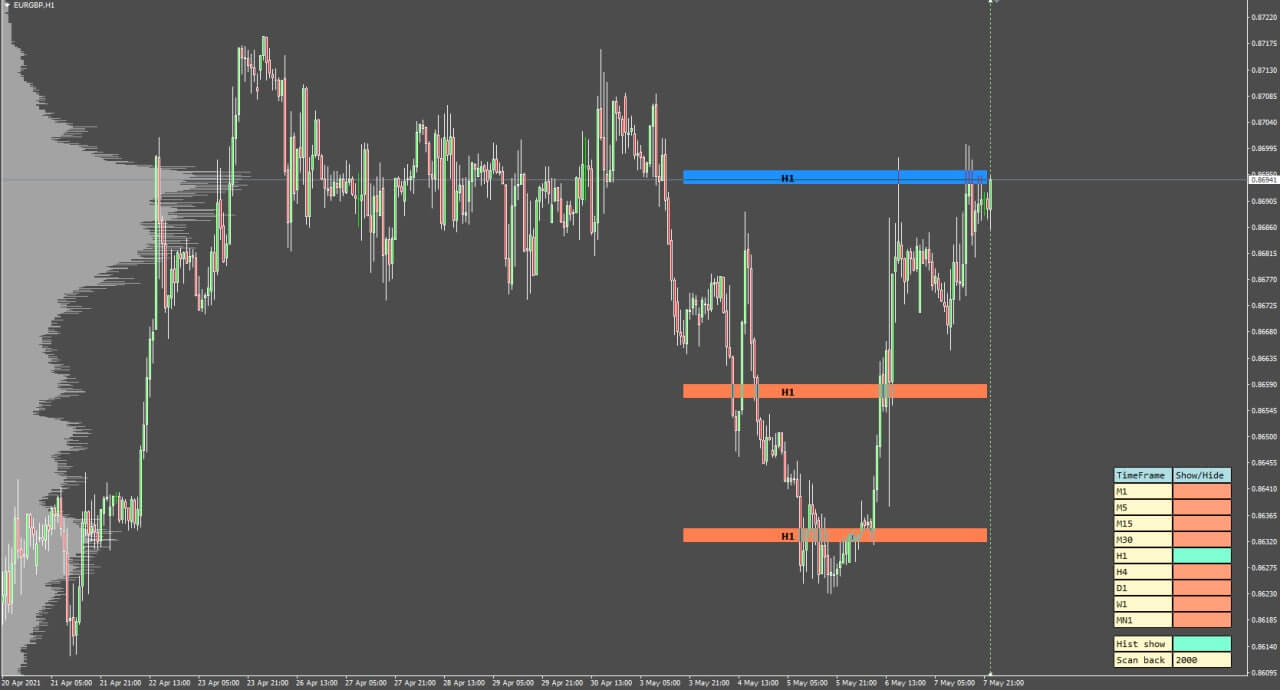
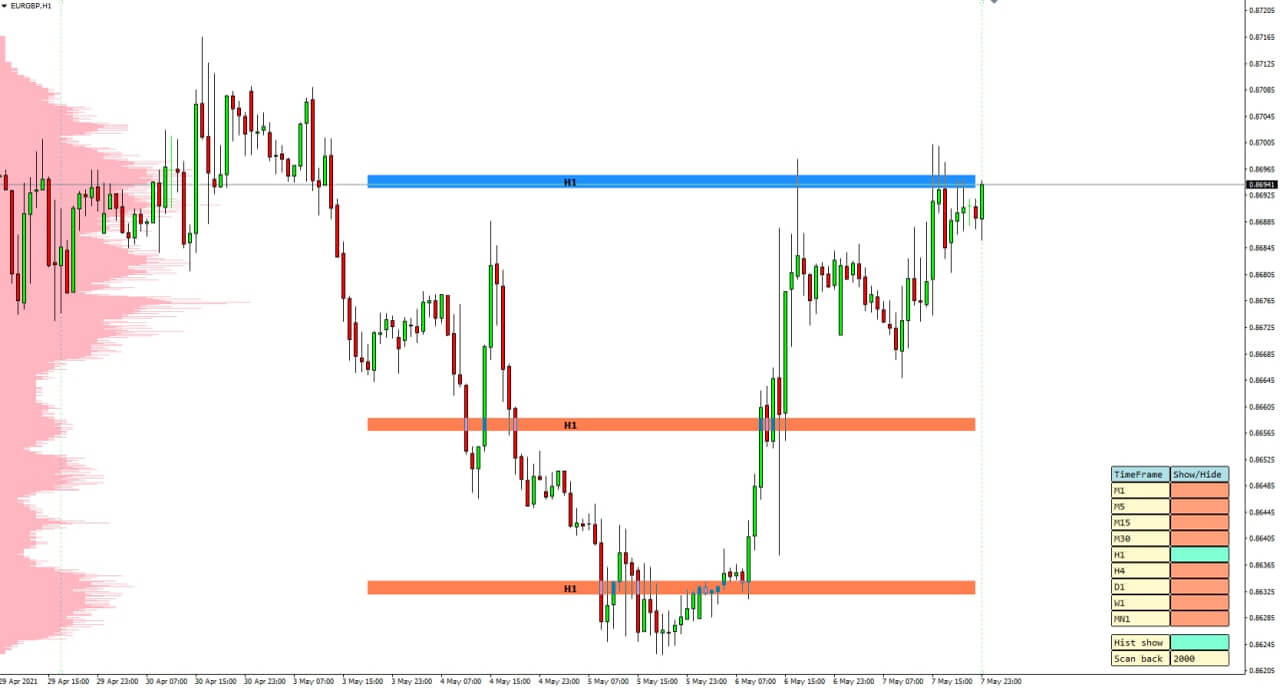
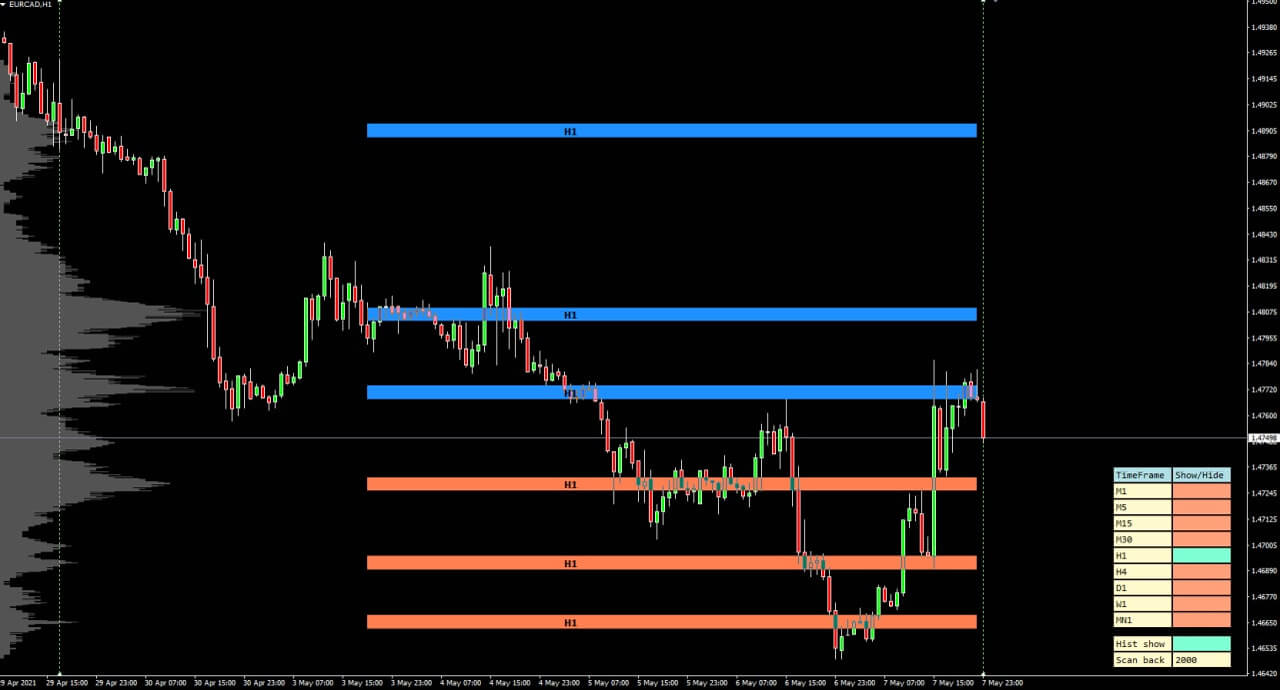
Our indicator scans for both the volume profile and the support resistances for you in your desired period!
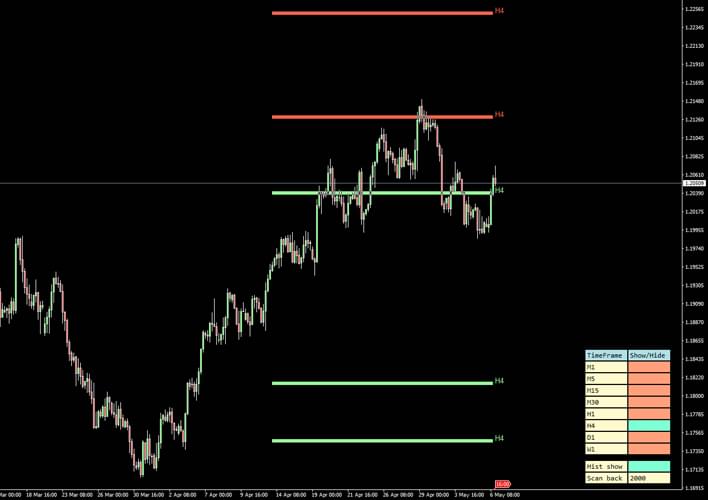
The best part – you can see support and resistance levels from ANY time frames without switching the time frames!
For example, you are on 1H time frame, and you want to see the daily or the weekly levels – NO PROBLEM! We have this option enabled for you!
Vladimir Ribakov is a professional trader, certified chief technician, and an online mentor with a vast community of home-based traders.
In his trading sessions, he often spots a need for new indicators which don’t exist yet, or if they do exist, he doesn’t trust them.

To bridge the gap, Vladimir leverages his personal and dedicated developer that codes trading programs and software to fulfill his trading needs.
From time to time, when an idea turns into a tool, and it is consistently successful, Vladimir opens it to the public. Let there be no mistake. Vladimir creates these intuitive trading tools to invest more accurately and increase the number of trading opportunities. However, if he notices demand from his trading community, he will share his trading tools with his community.
As you have put together, Key Trading Levels are one of the newest additions to Vladimir’s arsenal of revolutionary trading tools.
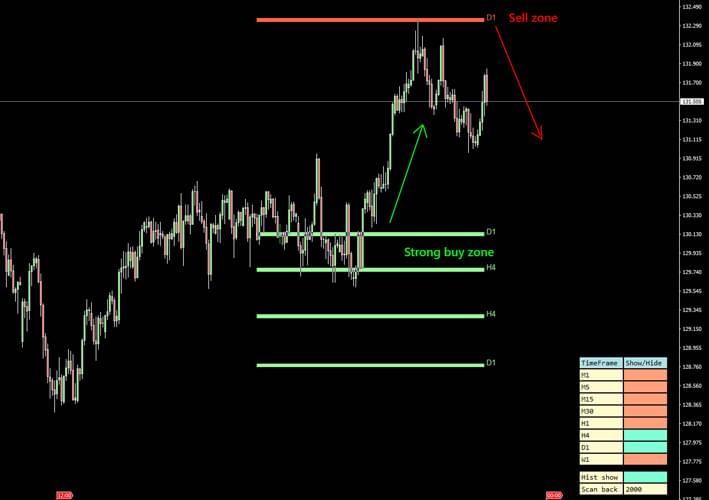
It is a known fact that most of the traders press the sell button and the buy button earlier than they really should. The main reason is that most traders don’t know the real levels where the action is likely.
Key trading levels is the REAL edge successful traders have over the rest of the traders. Key trading levels are the levels where action is likely to happen from and also the targets that the market usually reaches.
Such levels point you to the right instruments and the right levels to trade from and provide you a real edge over other traders.
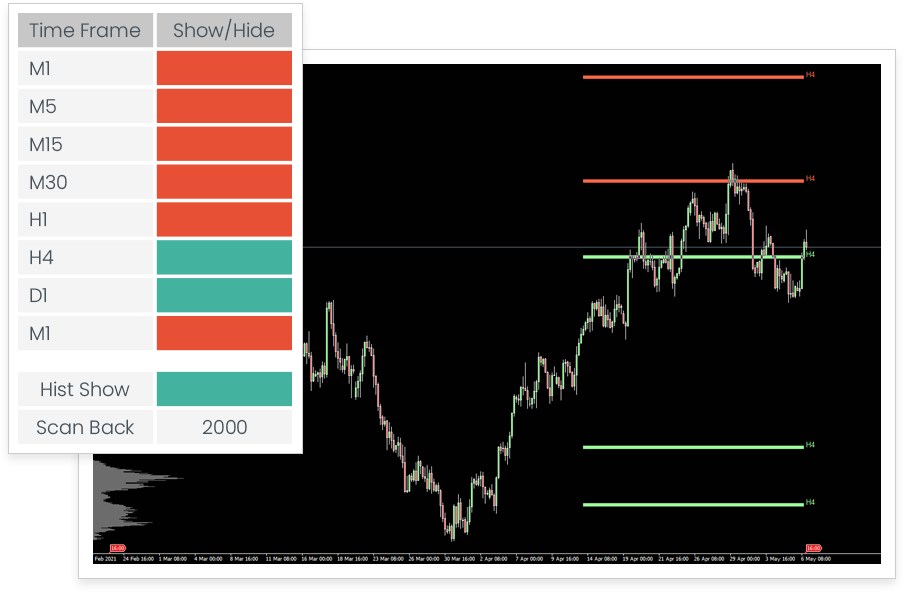
There are different kinds of indicators on the market. Lots of support and resistance indicators and some volume profile indicators. But they are limited in the way they deliver you information.
Our indicator combines both options for you, in a complete multi time frame control and a scan-back control. Our automated scan for lowest available tick data guarantees you get the most accurate data in terms of real price and levels.
You get a real benefit of an indicator that scans the key levels for you:
Our indicator scans the lowest available price data. MT4/MT5 doesn’t offer a use of historical tick data, so the most accurate method is to scan through the lowest available bar price.
Our algorithm does that exactly for you so you don’t have to worry about the accuracy of the quotes! This creates a real price based volume profile from which the real support and resistance in the market are built. Our algorithm scans back on any of the time frames you ask and gives you the most accurate data in return.

(One-Time Payment)